

Candlestick Patterns Indonesia

Description of Candlestick Patterns Indonesia
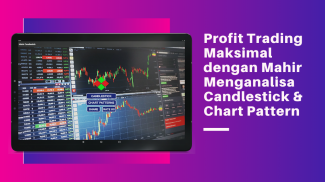
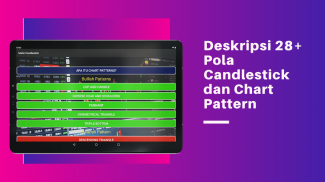
Candlestick Patterns is a reference application for analyzing trading opportunities and price trends by paying attention to candlestick patterns, chart patterns, modern technical analysis, plus fundamental analysis.
Candlestick Patterns are intended as a brief reference for recognizing and analyzing the basic forms of candlestick charts and chart patterns which are most often used to predict the direction of stock price movements or other trading assets by analyzing historical price patterns that have been formed.
This application is also equipped with a guide on how to understand modern technical analysis based on statistical science which is widely used in modern trading systems such as Moving Average, Relative Strength Index, MACD, Stochastic Oscillator, and others.
We also add fundamental analysis material to objectively look at the condition and financial health of the issuer or company whose shares you are trading in, so that the trading process is not limited to relying on price analysis and daily trading volume, but can also objectively assess the quality of each stock issuer. .
A good understanding of price movement patterns and fundamentals helps you set trading entry and exit points to achieve optimal profit targets when the market is bullish, or set stop loss points with minimal losses when the price trend changes in an unexpected direction (bearish reversal).


